The decision either to drive your children to school, or send them by Collge bus is increasingly perplexing. Monetary and time are issues, as is the important question of carbon pollution. So to assist parents in making a choice of which mode of trasport is best, we will explore the car versus bus equation.
Sample family – Case study parameters
- Family lives in Buderim, approximately 12 kilometres from the Suncoast Christian College.
- One one child attending the College.
- Each day, Mum drives her child to school in a mid-sized SUV.
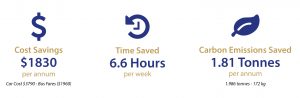
If they opt for the College bus their likely savings are as follows.
Here is how we worked it out
Car |
College Bus |
|||
Cost of Car |
Cost of Bus |
|||
| Distance to College (from Buderim) | 12 kms | Buderim is a Zone 2 bus. One child cost per term |
$490 | |
| 5 two-way trips per week | 120 kms | Cost per annum for one child (4 Terms) | $1,960 | |
| 40 school weeks | 4800 kms | |||
| Cost per kilometre of common mid-sized SUV* | $0.79 | Time-Saving – more time for Mum | ||
| Cost per annum | $3,790 | No travel time for Mum | ||
| Since the child now travels by bus, Mum now has an additional 6.6 hours free time each week – time she can now use for other pursuits or to earn additional income | ||||
| Time Cost | Time expended – weekly | 0 | ||
| Travel time to College (one way from Buderim) | 15 mins | |||
| Travel time – 2 x back/forth trips per day | 60 mins | Environmental Cost | ||
| Daily car park delays (morning + afternoon) | 20 mins | Carbon emissions or Co2 (g/km) of School Bus*** | 1395 Co2 (g/km) | |
| Time expended – weekly | 6.6 hours | Seats on Bus | 39 | |
| Per Seat/per km share of Bus Co2 emissions | 36 Co2 (g/km) | |||
| Environmental Cost | Kilometres travelled | 4800 | ||
| Carbon emissions or Co2 (g/km) of a mid size SUV** | 279 Co2 (g/km) | Per annum, per seat share of bus Co2 emissions | 172 kg | |
| Kilometres (school trips) per annum | 4800 km | Per annum carbon emitted by bus (per 1 child) | 172 kg | |
| Per annum carbon emitted by car | 1.986 tonnes | |||
*Source: https://www.racq.com.au/cars-and-driving/cars/owning-and-maintaining-a-car/car-running-costs
**Co2 (g/km) = grams of Co2 emission for each kilometre of travel by gasoline within urban environments. Emission data sourced from https://www.greenvehicleguide.gov.au.
***The College uses a King Long 39 Seater bus for the Buderim run. This bus complies with the Euro 5 emissions standards as adopted by the Australian Government. Currently, no Co2 (g/km) data is available for this model bus, so for the purpose of this comparison, we make the generous assumption that the King Long 39 Seater bus might emit five times the Co2 emissions of the mid-size SUV used in this comparison. Thus we make the assumption that the Co2 (g/km) is 5 x 279 or 1395 Co2 (g/km).